Animation
It is quite easy to produce an animated figure (in GIF format) based on a sequence of plots. This can then be used in web pages etc. There are now many animated gif creators available (search the web using 'Create animated gif'). These operations can be carried out by, for example, The GIMP.
With The GIMP, simply generate the sequence of ps files in PhreePlot, import them as separate layers, autocrop them, reduce their file size by optimization and then save as an animated GIF file: File|Open as Layers... then Image|Autocrop Image then Filter|Animation|Optimise (for GIF) then File|Save as... choosing the GIF format. This last dialog gives a few options including the delay between images.
Other packages such as ezgif will combine, crop and resize images online.
Predominance diagrams
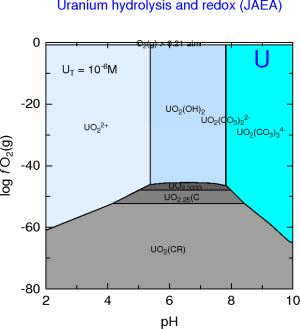
This example shows a sequence of predominance diagrams. It is based on the UCO3 demo in which the total uranium concentration is systematically varied from 10-16 M to 10-1 M in the presence of CO2(g) at 10-3.5 atm. The wateq4f.dat database was used. Delay = 500 ms.
Species distribution diagrams
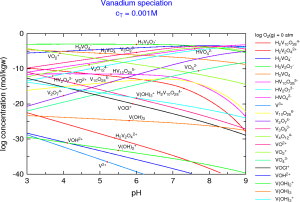
This example shows a sequence of species distribution diagrams for U as a function of redox status. It is based loosely on the Uspeciation demo in which the logP O2(g) (in atm) is systematically varied from -70 to -50 in the presence of CO2(g) at 10-3.5 atm. The wateq4f.dat database was used. Delay = 750 ms.
Up Home
_As1-300.png)
_As1-300.png)